Data Terminology - Part II

Welcome to my second of 3 posts around data terminology. In the first post, I focused on terminology that happens before analysis even starts. In this post I will discuss some of the terminology around data analysis and communication approaches.
Data Analysis Approaches
First, let me explain what I mean by data analysis approaches because this can also get somewhat confusing. When those in the industry think of data analysis, they probably think of the types of data analysis (descriptive, explanatory, predictive and prescriptive). Or, they might think of specific techniques like regression or cluster analysis. This is NOT what I will be discussing in this post. (However, if you are interested in learning more about types of analysis, I do cover them in considerable detail in my course Building a Data Mindset).
No, what I am referring to are overarching approaches because this is really where there is a lack of clarity in terminology and people often use the terms interchangeably.
Data Mining vs Machine Learning
A couple decades ago, this clarification would not have been necessary. At least not to those outside the world of statistics and computer science.
Data mining is the process of discovering patterns, correlations, and insights in large datasets using statistical techniques. Machine learning uses algorithms that can be trained to discover patterns, correlations and insights and continue to learn and improve as data is added and the algorithm is refined.
The outcome of these sounds pretty similar, doesn’t it? They are both designed to find patterns, correlations and insights that are used to help make business decisions or predictions. The difference is in how they go about doing it.

Data mining requires significant human involvement. Although a computer runs the calculations, a human drives the methodology, selecting and applying appropriate statistical techniques. The process involves continuous manual experimentation, learning, and adjustment to identify patterns or insights.
In contrast, machine learning is all about automation and minimizing or eliminating human involvement. A computer uses training data to develop an algorithm that updates and refines itself as new data is added. Whereas data mining depends on human involvement throughout, the goal of machine learning is to create an algorithm that identifies patterns and improves predictions with minimal human input.
Machine Learning vs Artificial Intelligence (AI)
Unlike data mining which requires human intervention, machine learning and AI both minimize human involvement. So, how do they compare?
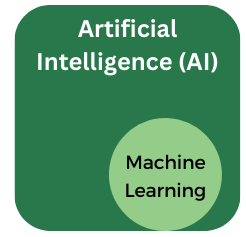
Generally speaking, machine learning is considered a subset of artificial intelligence (AI). AI is considered to be the broadest category that encompasses machine learning, neural networks and deep learning. I won’t be getting into the latter 2 in this post.
Machine learning appears to be intelligent because its algorithms are trained on data and they are refined and updated – or appear to learn – as new data is added.
On the other hand, the goal of AI is not just to identify patterns using existing data but to also go beyond what it is given to solve problems. AI attempts to simulate human intelligence.
Data Communication Approaches
Data Visualization vs Data Storytelling
Probably one of the things that is still debated in the data analysis community is whether a data visualization is a data story. But the most reasonable explanation is that just as machine learning is a subset of AI, data visualization is a subset of data storytelling.
Data visualization uses graphs, charts or other visual aids to represent raw data. Using a visual makes it easier to see what’s happening. One of the comparisons that really stuck with me was from Cole Nussbaumer-Knaflic’s book Storytelling with data where she said “tables interact with our verbal system, which means we read them... (whereas)...graphs interact with our visual system, which is faster at processing information” (p. 40, 43).
Many people quote the adage “a picture is worth a thousand words” and assume that the data visualization (or picture) is the data’s story. They are not wrong in this comparison. But they are not exactly right either.
A graph or other visualization does have information to share but it can be interpreted differently depending on the viewer. Enter data storytelling. Data storytelling focuses the audience’s attention to take them on a well-crafted and targeted journey. Data visualizations help provide context and make connections but they are only supports for the overall data story. They are not the story themselves. It is the data storyteller who crafts the narrative to ensure the audience has a consistent view of the information and can understand – and maybe even agree to taking – the recommended actions.

I just recently came across this analogy on leapmesh.com that summarizes the complementary relationship between data visualization and storytelling as: “Data visualization is a map that shows the layout of the land. Data storytelling is the tour guide who explains each landmark.”
Conclusion and References
I hope this post provided some clarity around terminology relating to the different approaches to data analysis and communication. At the end of this post, I am including links to the references I used to supplement my own experience and knowledge in these areas.
Please also check out my next post where I discuss some of the terminology in data management.