Data Terminology - Part III

Welcome to my third of 3 posts around data terminology. In the first post, I focused on terminology that happens before analysis even starts. In the second post, I went over some data analysis and communication approaches. In this post I will discuss some of the terminology around data management.
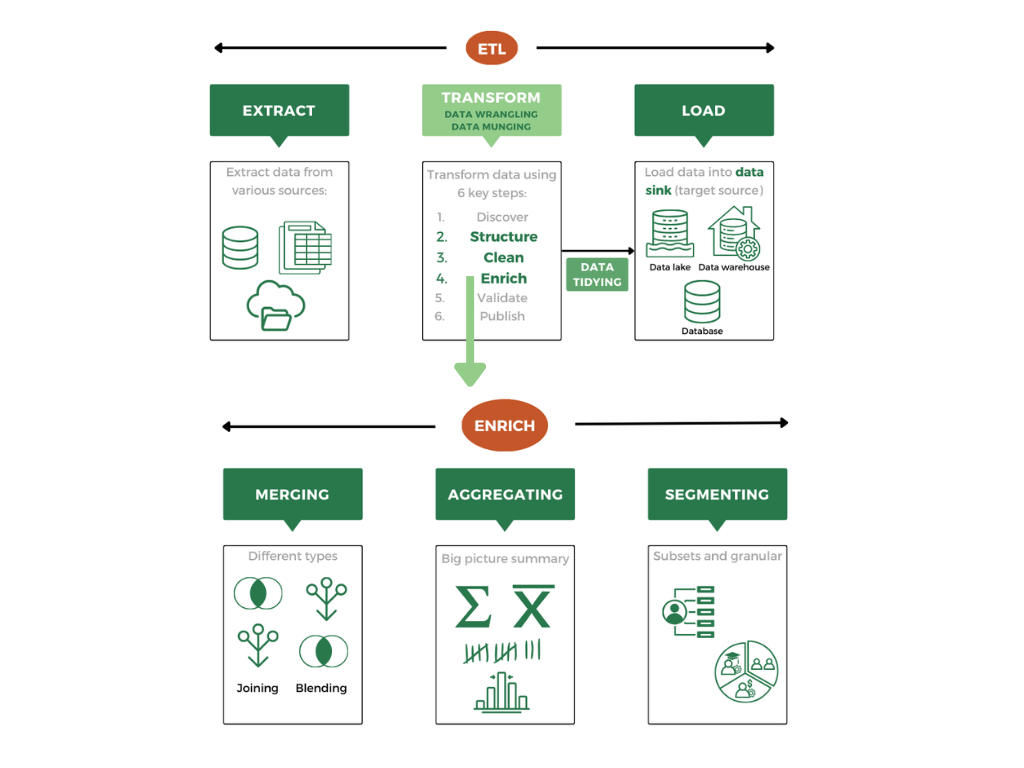
Data Management
What is data management? While definitions tend to be fairly similar, Tableau defines data management as “the practice of collecting, organizing, protecting, and storing an organization’s data so it can be analyzed for business decisions.” Databricks defines data management as “the day-to-day, technical and operational processes that ensure data is properly collected, stored, maintained and made accessible to users”.
As the volume of data available for analysis increases and people get more concerned about how their personal information is used, not only are concepts in data management being discussed more but it is becoming more important for organizations to have robust data management processes. Which leads us to more terminology that needs to be reviewed, specifically related to data management.