Meet me in the middle

I have to say, there is no shortage of data being provided during the COVID-19 pandemic. Every day in Alberta at 3:30pm our Chief Medical Officer provides updates, including the number of new and recovered cases. There are also Kaggle competitions trying to get people to build data models to better understand this virus and predict its spread. Not to mention all the research going into its causes and creating a vaccine. And then there is my current favorite site – updated daily – and it includes geospatial information (including an interactive map), age group, and gender breakdowns.
The funny thing is that I know many people who are also checking various sites and research and making comments on group texts or social media about certain trends. These are people who would have balked at an exponential growth chart or stacked bar graph only a couple months ago. This pandemic is making many people look at data differently. Here is a funny graph my sister sent me since she knows how much I like a good data joke:
So, I thought now that more people are interested in data and trends, it might be a good time to provide a brief lesson on some introductory statistics that I feel are extremely useful in the business world. These statistics come in handy if you are doing split (A/B) testing or trying to compare averages or proportions in one campaign compared to another.
I will discuss the following statistical concepts in a 3-part post, of which this will be the first:
- Measures of central tendency – mean, median and mode
- Distribution curves with a focus on normal distribution
- Hypothesis tests and statistical testing
This post will focus on the first topic, which is measures of central tendency.
I should note though that I’ve only used one COVID-19 example below as the focus of these posts will mostly be on the statistics themselves and not COVID-19 in particular. I mention the pandemic mostly because it was the impetus for me to write these series of posts, seeing how the appetite for data has grown in the last few weeks.
Measures of Central Tendency
These are ways to summarize an entire data set in a single number. This number is meant to describe what is typical in the data set (in the case of mode) or what the middle or “centre” of the distribution is (in the case of mean or median). There are 3 measures of central tendency: mean, median, and mode. Now, I’m not sure about you, but I find it funny that all 3 measures start with the letter m and are supposed to represent the middle of the distribution, which also starts with the letter m. No? Okay but as Sesame Street says, this presentation is brought to you by the letter M. 😊
MEAN
Definition: This is the one with which people are most familiar. It is also called the average or arithmetic average.
Calculation: add up all the observations and divide by the total number of observations.
Uses and Examples: only for data that can be added and divided (know as interval or ratio, discrete or continuous data). For example, height, weight, or grades on an exam are all examples where mean can be used.
For example, if you had the following grades on an exam: 72, 64, 87, 91, 82, 87, 77, 78 you would calculate the mean (or average) by adding up all the grades and dividing by the total observations:
(72 + 64 + 87 + 91 + 82 + 87 + 77 + 78) / 8 = 638 / 8 = 79.75
So, the mean (or average) grade on this exam is 79.75% (or you could round it up to 80% if you want a whole number).
Pros: easily and quickly done on a calculator or in a spreadsheet. Measure with which people are most familiar so even non-Math people tend to understand how to calculate and use it. Can be used in a variety of data situations.
Cons: is sensitive to outliers or skewed data and cannot be used on categorical (or nominal) data. Why not? As an example, if you asked a class what their favorite ice cream flavour was and counted the responses you might get the following:
Ice Cream Flavour
Responses
Vanilla
18
Chocolate
27
Mint Chocolate Chip
5
What is the average here? How do you take the average of vanilla, chocolate, or mint chocolate chip? You can’t add them up like you can for grades on an exam. All you can do is describe the data by saying something like Chocolate was the most commonly chosen flavour, which I will discuss below.
MEDIAN
Definition: when data is arranged in increasing or decreasing order, the median is the middle value.
Calculation: this is easy if you have an odd number of observations. For example, if you have 11 observations then the 6th observation is the middle value because 5 are smaller and 5 are larger than the 6th value. If you have an even number of observations then you take the mean of the two middle values. For example, if you have 10 observations, you’d take the mean of the 5th and 6th values.
Uses and Examples: if the data can be ordered and a middle value can be found, the median can be used. Since the mean tends to be the most common measure (and is the basis for many statistical tests), median is often used as a check on mean to see how skewed the data is. For example, let’s say you have the following orders on your website where the Order Number is the order in which the transaction occurred and the Ranked Order is the transaction’s order after it has been sorted from smallest value to highest value (for calculation of the median):
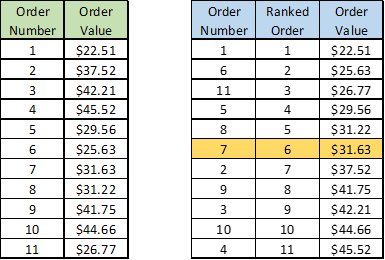
As can be seen, there are 11 orders and order number 7 is the exact middle value (as it is the 6th observation out of 11 observations when sorted in ascending order) . So, in this case the median order value would be $31.63. In comparison, if I added up all the order values and divided by 11 to get the mean I would get $34.45. These are still fairly similar so there might be a slight skewing to higher order values using the mean but not too much. Now, what if the data looked like this?
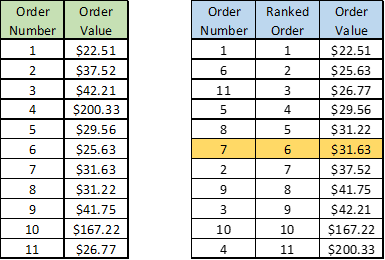
The first 9 orders are still the same but the highest two have increased substantially. The median does not change and it is still $31.63; however, if I add up all the order values and divide by 11, I get a mean of $59.67. These two measures of central tendency (mean and median) have very different values so it tells me the data has some outliers or is skewed to higher order values. If you want to know what the real “middle” value is for this data set, median would likely be a better metric because only 2 of the 11 values are higher than $43 making a mean of $59.67 not very representative.
Pros: from the example above, median is less affected by outliers or skewed data. Median is therefore often used when distributions are not symmetrical or there are a few outlying pieces of data that are not very representative of the entire set.
Interestingly, if you look at the age-related data on COVID-19 right now, you will see it mostly being reported using the median age of people diagnosed or who have died. This is because there are fewer cases in the <20 years old group making the data skewed to older ages. And then in some reports it seems as though they might be using average and median interchangeably like in this Forbes report or this Australian article. It made me want to use my eyebrow-raising emoji.
Cons: similar to mean, median cannot be used with categorical (or nominal) data. Also, even though being less sensitive to outliers is considered a pro for median, in can also be a con. Sometimes identifying outliers or skewed data (i.e. the shape or distribution of the data) can provide insight into certain behaviours or niche customers. Since median is less sensitive to outliers, these patterns can be harder to identify.
MODE
Definition: the value that occurs most frequently in a data set or distribution.
Calculation: just count up how many times each value occurs and the one that occurs most often is the mode. What happens if the highest frequency occurs for more than one value? Or what happens if all values occur with the same frequency? Or what happens if you have a variety of continuous data where no value occurs more than once? Well, then you could have a multi-modal or a no mode situation and it becomes harder to interpret and use the mode’s value.
Uses and examples: let’s say there is a price test on a website at 3 different price points of $20, $25, and $30. There are 12 orders at the following price points:
$25, $20, $30, $30, $30, $25, $25, $20, $30, $25, $30, $20
Counting how often each of the 3 different values occurs:

So, the mode would be $30 because it is the value that has occurred the most often.
Pros: mode can be used with categorical (nominal) data whereas the mean and median cannot. In the favorite ice cream flavour example above, mean and median couldn’t be used but using the mode we could say Chocolate is the most common flavour because it had the most responses. As a result, the mode for ice cream flavours would be Chocolate.
Cons: mode doesn’t always represent the “middle” of the distribution very well.
In the price test example above, the mode of the data was $30 because it occurred most frequently; however, the mean is $25.83 and the median is $25 for the same data. These two measures are very similar and centre around $25 whereas the mode is much higher at $30 so it is less representative of the “middle” of the data set.
Another limitation is there can be no mode or multiple modes (bi-modal with two modes or multi-modal with 3 or more modes). These become harder to interpret and use in probability models and distributions. However, if there is more than one mode it can often mean there is different underlying behaviour in your data, which can be both a pro and and con. I will discuss this a little bit more in the post on distribution curves.
SUMMARY
Each measure of central tendency has its own uses that come with both pros and cons. In general, the following rule of thumb has been useful for me when determining when to use which measure:
- When the data is in categories (nominal) where there is no real order to the categories (like the ice cream flavour example above) – MODE should be used.
- When you can rank something as first, second, third, etc (also known as ordinal data because it is like categories but it can be ordered) – MEDIAN would be best.
- When there are numbers you can actually use to do addition or division (known as interval, continuous, or discrete) but the data doesn’t have any outliers or isn’t skewed – MEAN would be best.
- When there are numbers you can actually use to do addition or division (like interval, continuous, or discrete) but the data HAS outliers or IS skewed – MEDIAN would be best.
- As a side note, many people tend to use mean instead of median because they are more familiar with it and don’t usually test for outliers or for what the distribution of the data looks like. Or, as mentioned earlier in the COVID-19 data, they are not familiar with the difference between mean and median and use the terms interchangeably.
If you want to know more about data measurement definitions, (referred to as nominal, ordinal, interval, or ratio) here is a website that gives some good examples.
So, now that you have a good idea of how to find the “middle” of a data set and when to use which measure, we can move on from the letter M to the letter D for data distribution. Stay tuned for more on that in the next post!